Testing Strategy
Since truelearn is a Python library targeting developers, researchers and learners, we must conduct comprehensive tests to ensure that its functionality, usability and stability meet the desired standards outlined in our MoSCoW list.
Test Methodology
Besides the truelearn.utils.visualisations sub-package, the library should be tested by unit and integration tests. We will use PyTest with pytest-socket (control access to the Internet), pytest-cov (generate coverage report) and doctest (documentation tests). We will run these tests on three operating systems (OSX, Linux, Windows) and five Python versions (3.7-3.11) to ensure the compatibility of our library.
For visualisations, we will conduct user acceptance tests by consulting our users, who are developers and learners, setting up different test cases for them and asking them to provide feedback.
Continuous integration
We have also deployed several continuous integrations (CI) tools in GitHub to automate the testing process. These tools include:
PyTest: run all the unit and integration testsprospector: check for security and style issues and violations of linting rulesblack: check for code formatting issuestypos: check for typoscoverage: check for test coverage, which is used to guide us to improve tests
Unit and integration testing
Unit tests are the first type of test added to the truelearn library. In truelearn, there are two forms of unit tests.
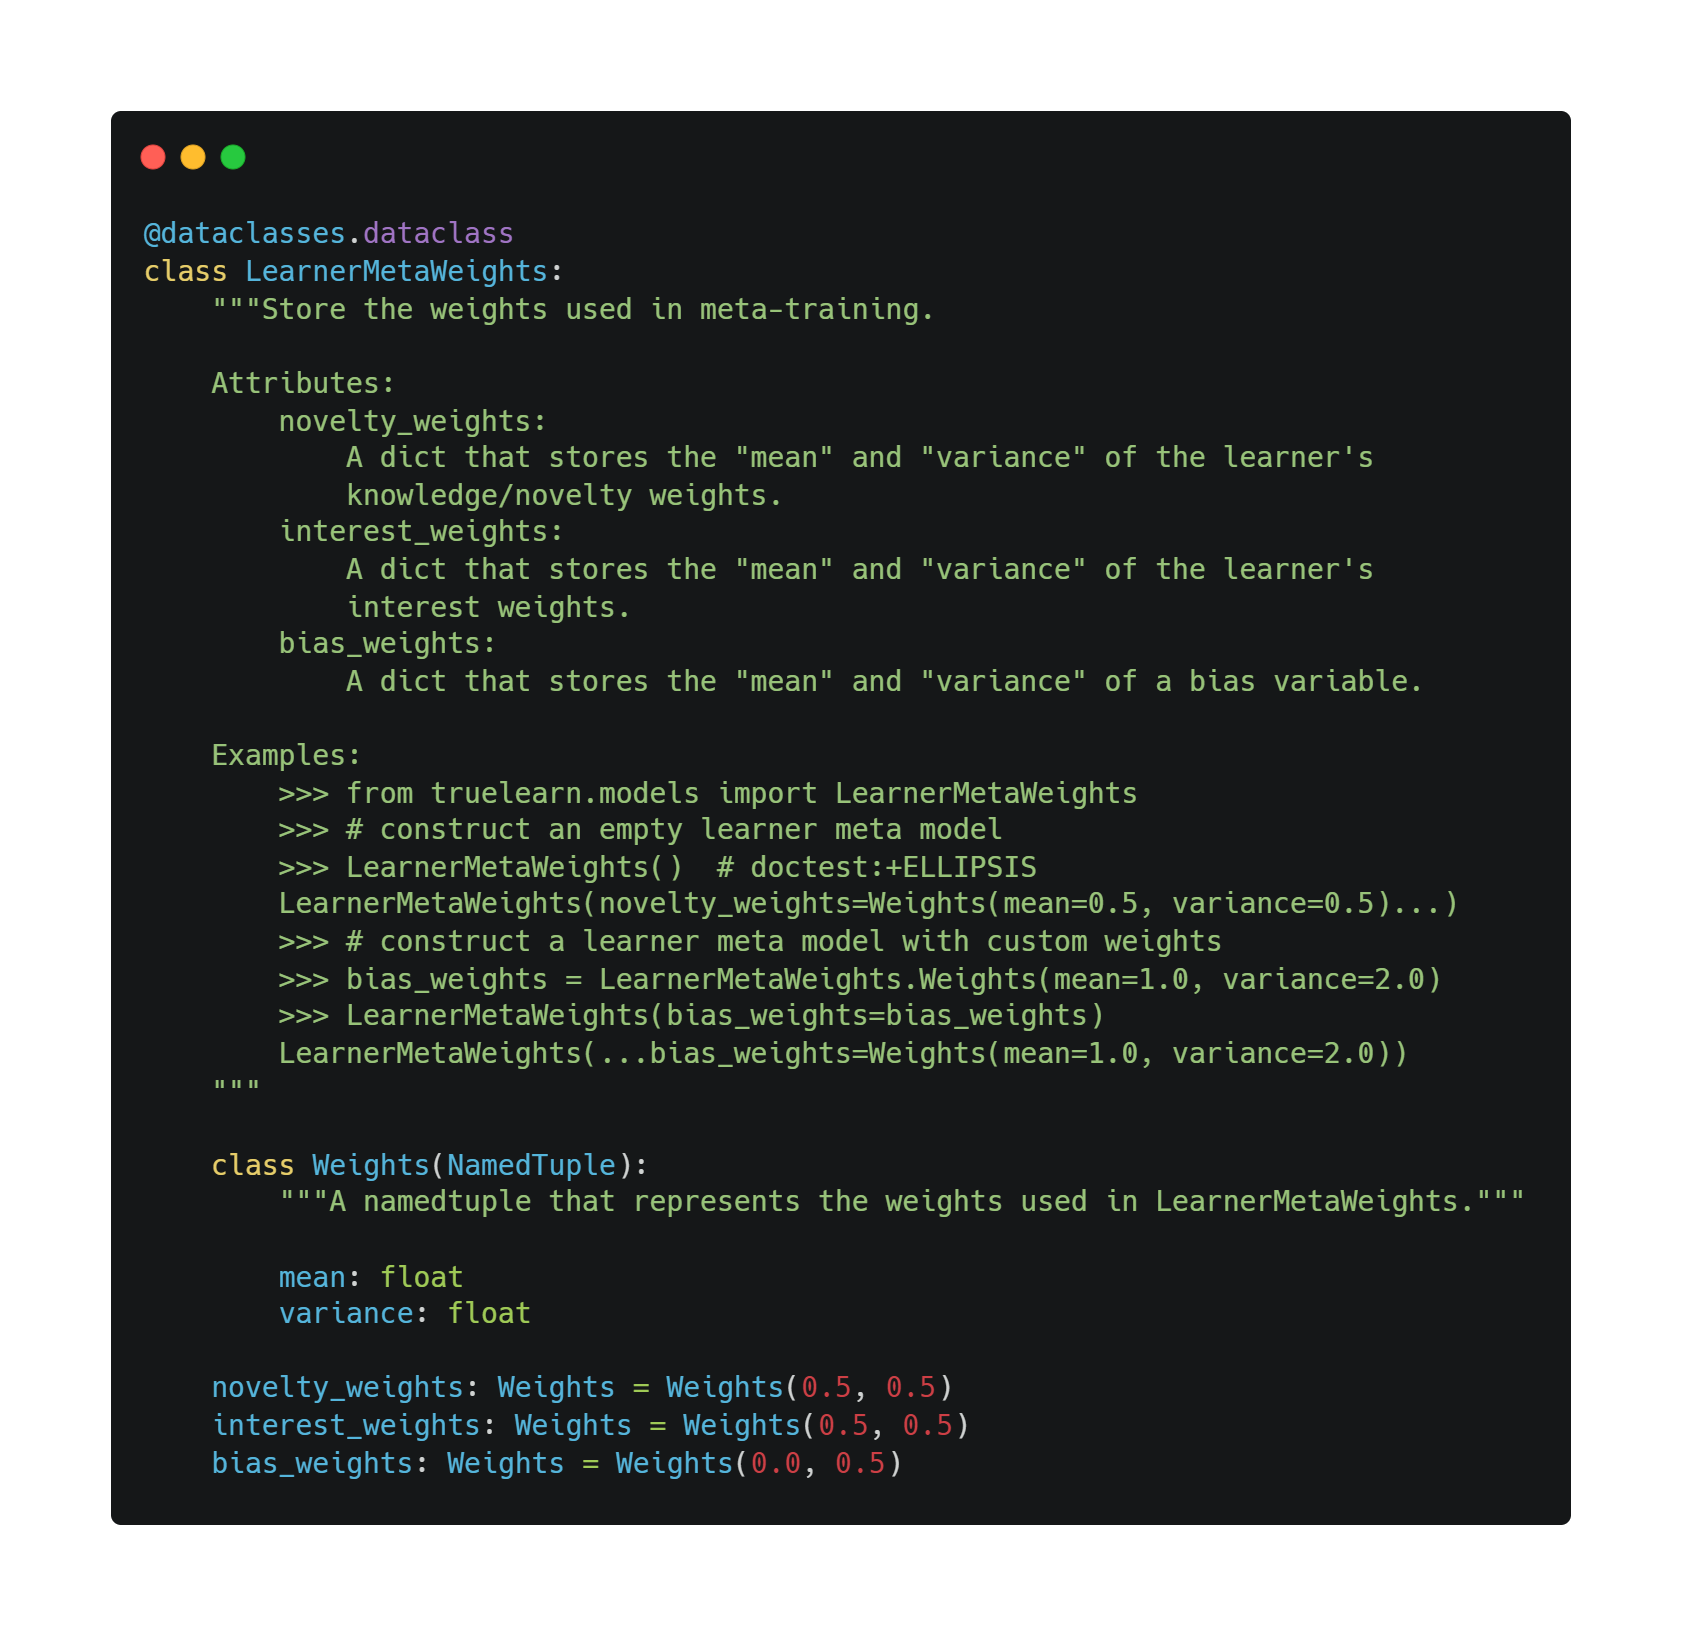
The first form is based on doctest. For most of the classes in truelearn.models and truelearn.learning, we have added examples of how to use itself in its docstring and provided some expected output. When the doctest test framework runs the doctest, it will run these examples and compare the actual output with the expected one.
The second form is the traditional unit test where we test all the subpackages and modules in our library.
Simultaneously, instead of purely relying on unit testing, we apply integration testing on testing classifiers (e.g. KnowledgeClassifier, NoveltyClassifier, InterestClassifier and INKClassifier) and visualisations.
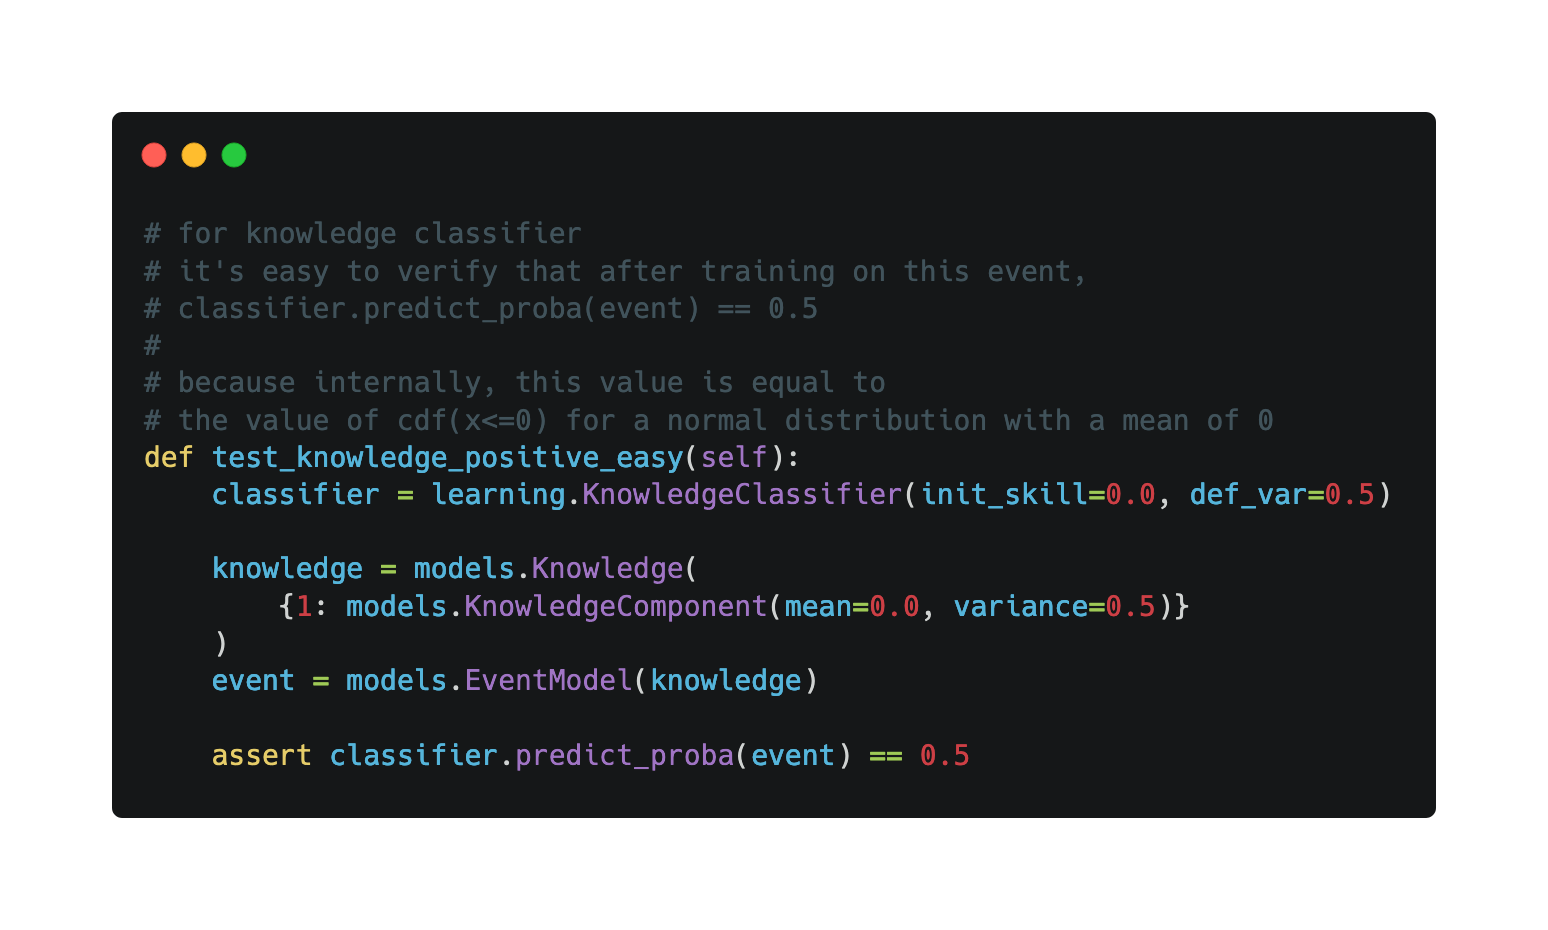
For classifiers, some of their methods, like fit and predict, read or update with learner and event models, which complicates testing. In order to successfully test them, we have carefully crafted some test cases based on the mathematical principles behind them.
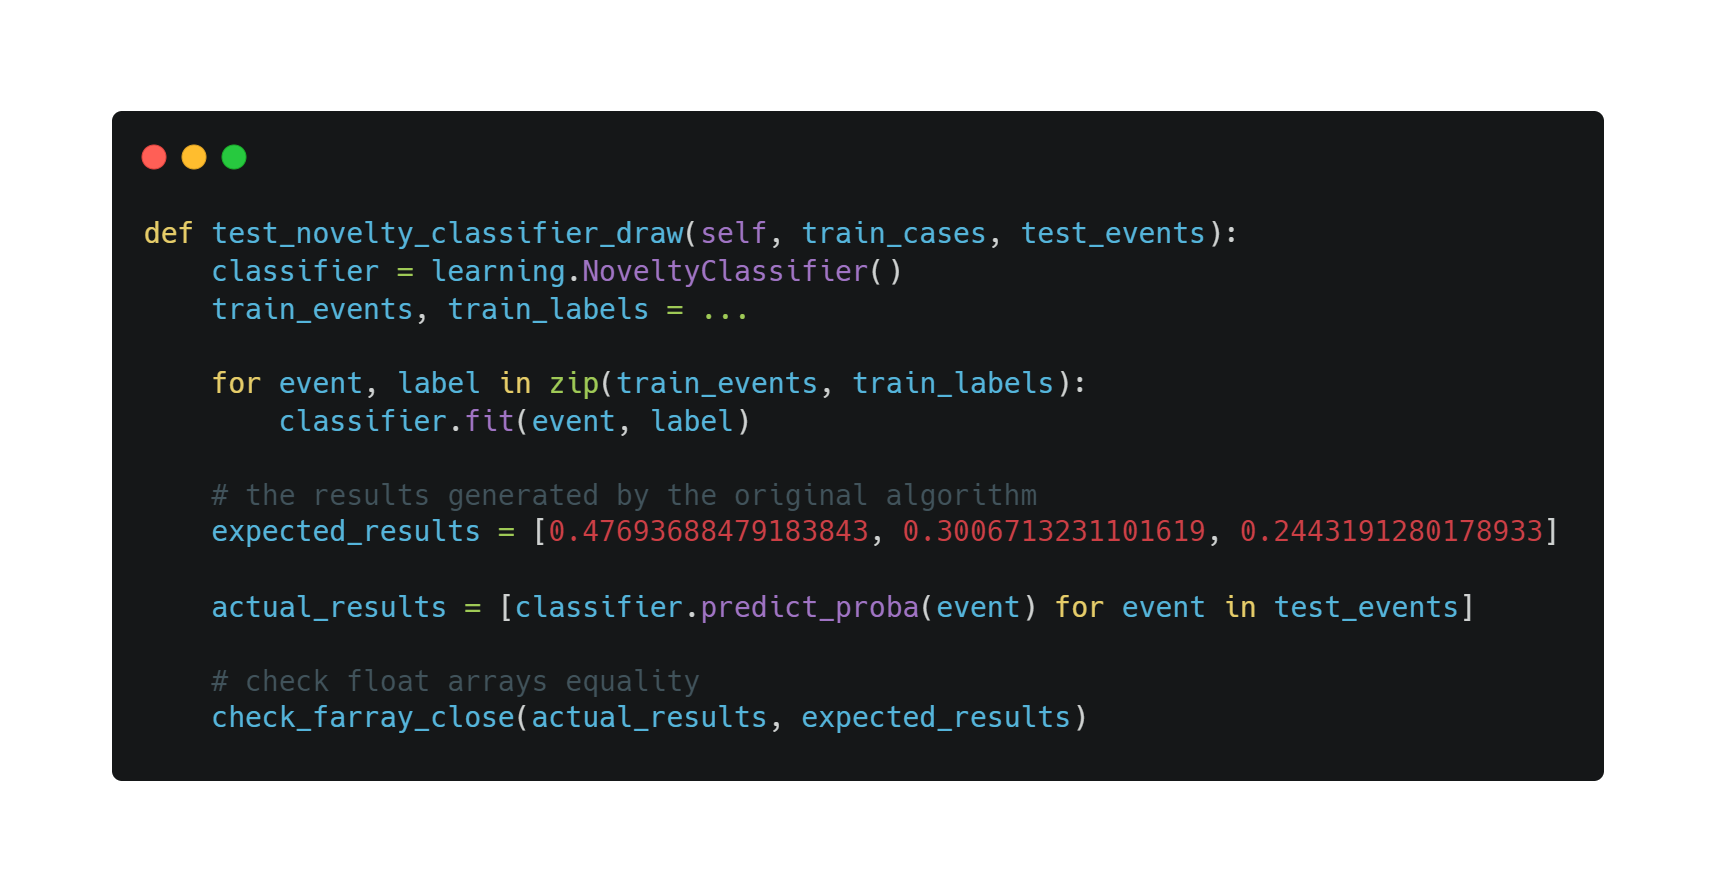
Since we have the original algorithm logic for the classifier, we also generated some random inputs and compared the output of the existing algorithm with that of the original one.
For visualisation, we are primarily concerned with the charts generated. So, we selected some sample Knowledge and used the visualisation sub-package to generate some baseline files, which are placed in truelearn/tests/baseline_files. The integration tests for our visualisations sub-package are mostly to test whether we can produce images that are identical or similar to the baseline files across platforms and versions.
For matplotlib-based plotters, we focus on generating similar png files. For plotly-based plotter class, we focus on generating html and json files. The reasons for such choice are
- matplotlib: matplotlib itself has tests to ensure that images in different format can be correctly rendered and exported. So, we only need to ensure that one of the images types work correctly. At the same time, testing different file extensions requires the installation of special external dependencies (GhostScript and Inkspace). These make the testing process pointlessly complex and make it difficult for developers to run our tests in a simple manner. Thus, we only choose to test png file.
- plotly: plotly supports the export of figures to static (png, jpg, pdf...) and interactive (html, json - which can be used by plotly.js on the front-end) formats. The reason we only test to html and json output is because of the limitations of its backend. The backend it uses is
Kaleido, which uses Chromium internally to export the images. Based on our testing, we found that due to chromium's font rendering policy, there was no way to generate the same/similar images on different operating systems, even if we used the same font, which made it impossible to replicate our testing for images. So we decided to use only reproducible (with a little setup) html and json formats for our tests.
By using these tests, TrueLearn achieves 100% test coverage.
Evaluating Default Values
As stated in our research, we wanted to choose default values for our classifier so that it performs reasonably. To quantitatively assess what are reasonable results, we used the classifier performance as a metric and conducted several tests based on the PEEK dataset.
Since we wanted to investigate how sensible the results generated by the default values are, we ignored the train.csv file in the dataset, which is used for hyperparameter training. We only utilized the learning events in the test.csv file and conducted experiments on all learners and the 20 most active learners in the training set.
The following three tables show the weighted average test performance for accuracy, precision, recall and F1. The first two tables are the results we collected in our experiments using the default values we eventually chose. The third table shows the results of the classifier after hyperparameter training, presented in “TrueLearn: A Bayesian Algorithm Series for Matching Lifelong Learners with Open Educational Resources" by Bulathwela, et al.
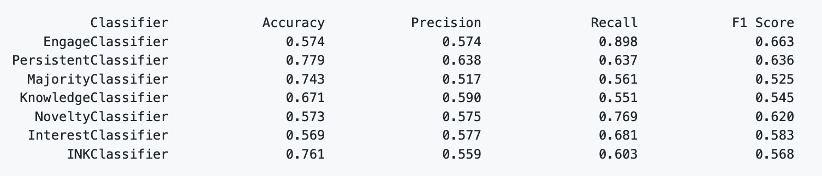
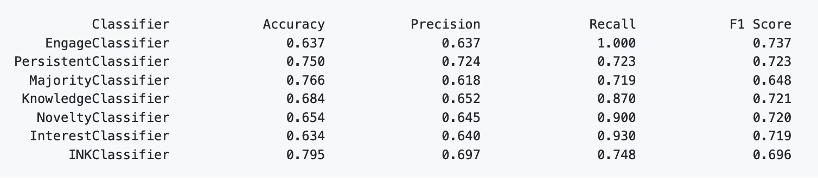
The performance of classifiers on all learners
The performance of classifiers on the 20 most active learners
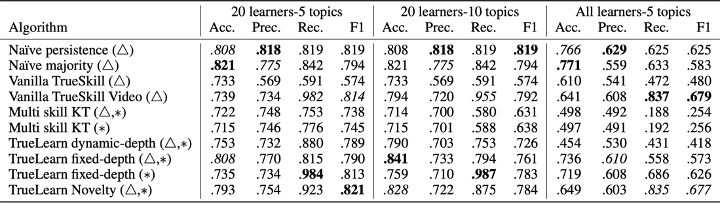
The performance of classifiers, presented in the TrueLearn paper
As can be seen from these experiments, the default values we chose for the classifiers are sensible: for the KnowledgeClassifier and the NoveltyClassifier, they perform close to or even better than the hyperparameter-trained classifiers (TrueLearn fixed-depth and TrueLearn Novelty) in terms of recall and f1 score. Also, we can see that the INKClassifier, which utilizes NoveltyClassifier and InterestClassifier internally, is ahead of most of the classifiers in terms of accuracy and precision.
Therefore, it is reasonable to conclude that by default, the classifier performs sensibly, which makes our library user-friendly.
Performance Tests
As stated in our MoSCoW list, we want the performance of our library to be comparable to that of the original code. Thus, we conducted performance tests by benchmarking our library against the original code https://github.com/sahanbull/TrueLearn.
Experiment Setup
Outline: We chose the KnowledgeClassifier and NoveltyClassifier (with their default parameters) for benchmarking, as each represents different assumptions in TrueLearn (so, different fitting and prediction methods), and they are publicly available in the original code. The functions we chose to benchmark are fit and predict, as they are the core of each classifier and are responsible for training and providing predictions.
Input: We used the PEEK dataset with the 20, 40 and 80 most active learners as input to our program. Below is an example of the input array.
[
    (learner_id, [(event1, label1), (event2, label2), ...]),  # first learner
    ... # second, third, ... learner

]
We focused on comparing the wall clock time and peak memory size under these different input sizes:
- The wall clock time takes into account the effects of external factors such as IO, context switching, etc. It gives us a more accurate picture of performance compared to CPU time.
- Peak memory size measures the maximum amount of memory used by a program during execution. Total memory allocated tells us the total amount of memory allocated during execution. We are more concerned about peak memory size in this experiment because this tells us how much memory the user will actually use when running the library/original code.
Method: We iterated over the input of all learners. For each learner, we iterated over its learning events. For each learning event, we first call the predict method of the classifier and store the returned result in an array. Then, we call the fit method of the classifier with event and label as parameters. Below is a high-level overview of the structure of our benchmark.
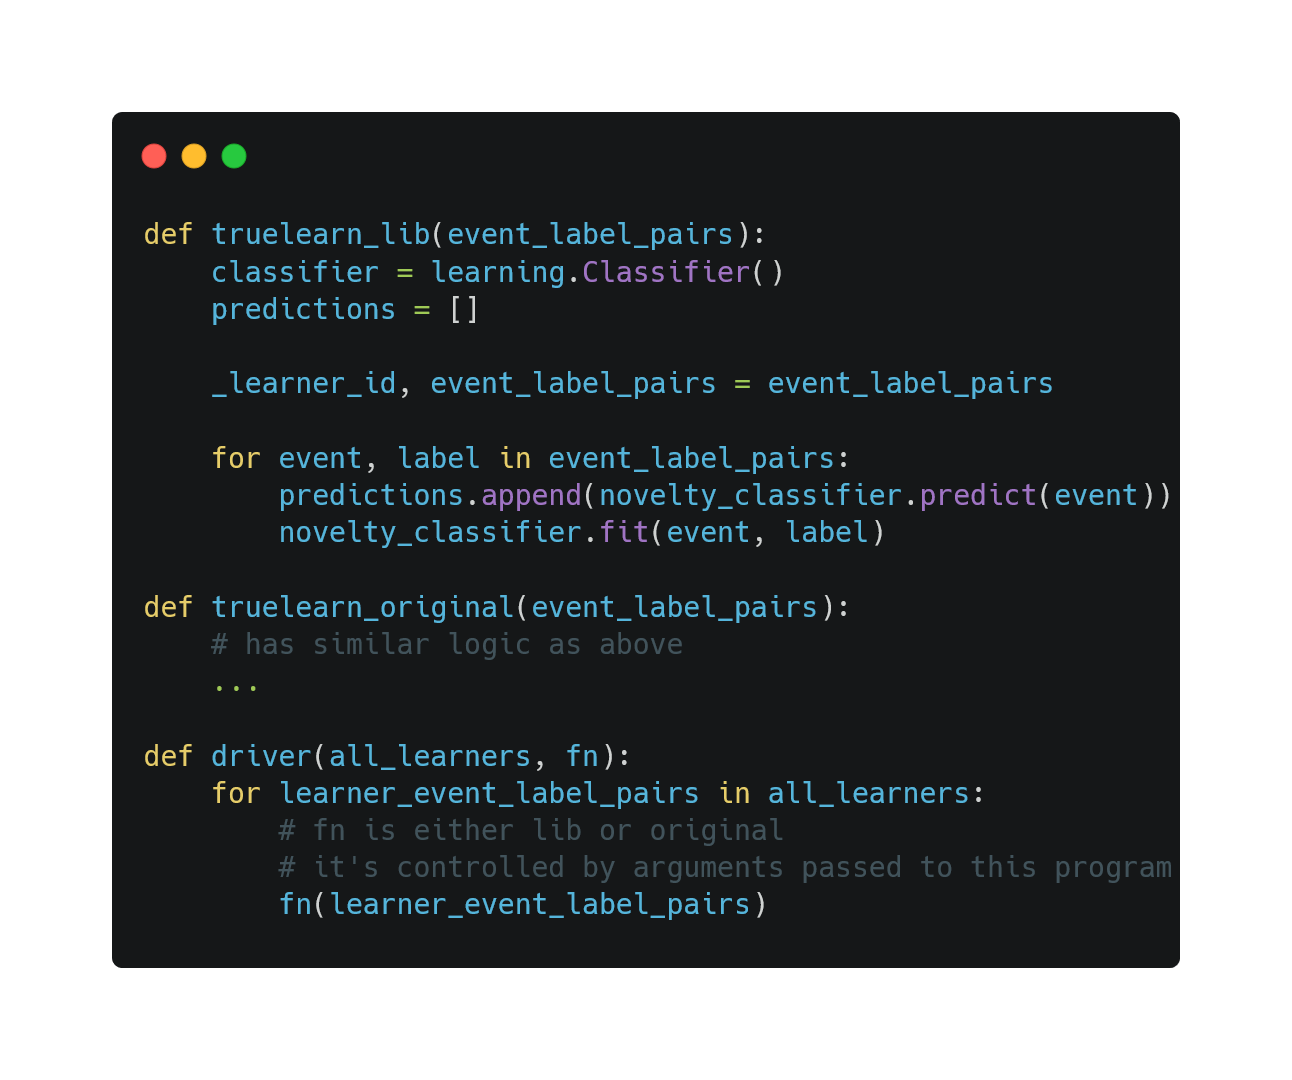
High-level overview of the structure of our benchmark
Tools: For time-based benchmarking, we use hyperfine, a state-of-the-art command line benchmarking tool that allows us to benchmark the wall clock time of our program without making any modifications. For memory profiling, we use memray, a memory profiler for Python that can “keep track of allocations in Python code, in native extension modules, and in the Python interpreter itself.” https://github.com/bloomberg/memray.
We ran the benchmarks described above with a single thread on a MacBook M1 and Python 3.7 (x86-64) and tweaked the original code slightly.
Results
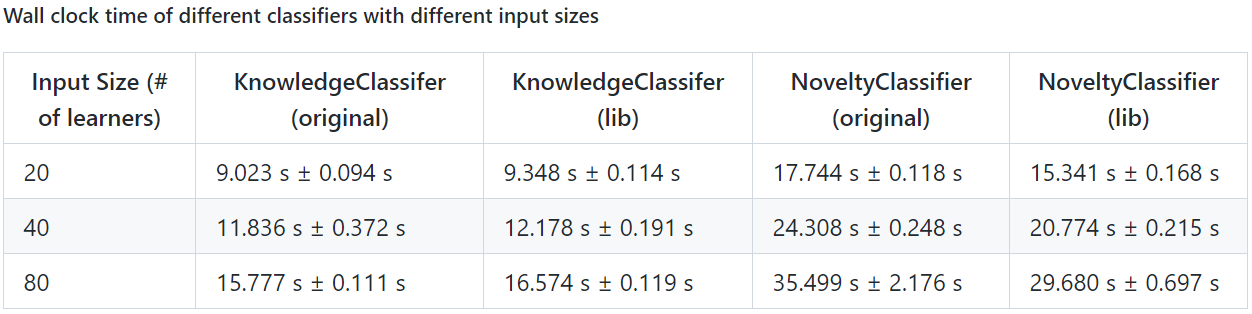
For timing, we get the following results:
From the table, we can see that:
KnowledgeClassifier: On average, the original code is 1.04 times faster than the library implementation. This is reasonable and acceptable as we track additional fields in the knowledge component, learner model and event model.NoveltyClassifier: On average, the library implementation is 1.17 times faster than the original code. This is because we have optimised an operation that calculates the average value of an array.- In summary, our knowledge classifier has comparable performance to the original code, and our novelty classifier is even 20% faster than the original code due to our optimisation.
For memory consumption, we get the following results:

-
KnowledgeClassifier: For different sizes of inputs, the raw code always consumes slightly more memory than the library implementation. As the size of the input increases, the difference between the memory consumed by the original code and the memory consumed by the library becomes larger and larger. -
NoveltyClassifier: When the input size is 20, the peak memory consumption of the original code and the library implementation is very similar. But, likeKnowledgeClassifier, as the input size increases, the difference between the memory consumed by the original code and the memory consumed by the library becomes larger and larger.
Based on the comparison of peak memory size, we can see that the peak memory consumption of the library does not exceed that of the original code.
In summary, based on our benchmarking results, it is reasonable to conclude that our library is comparable to or better than the original code presented in the TrueLearn paper.
User Acceptance Testing
To ensure our library performs its desired functionalities to the satisfaction of users, we gathered four users to use our library and complete three different surveys, for each test case. These results were then recorded and are displayed on a table which you can find below.
Testers
Denis L.
- Denis is a student studying Computer Science at the University College London.
- He has a strong desire for learning and is curious about what is around him.
- He often makes use of different Open Courseware websites to complement his learning and to discover new courses that spark her interest.
Steven M.
- Steven is a student studying Finance at the University of Oxford.
- He is looking to gain insights into what he learns and identify his weaknesses which is important to him in refining his knowledge.
Jack G.
- Jack is a software developer working for LinkedIn.
- He has several years of experience in developing educational platforms that provide online learning.
- He focuses on developing software that is well designed and scalable to masses of students.
Sarah S.
- Sarah is a software developer working as a part-time lecturer at the University of Cambridge.
- She wishes to effectively model learners to provide relevant videos that keep his learners engaged and learning.
Test cases
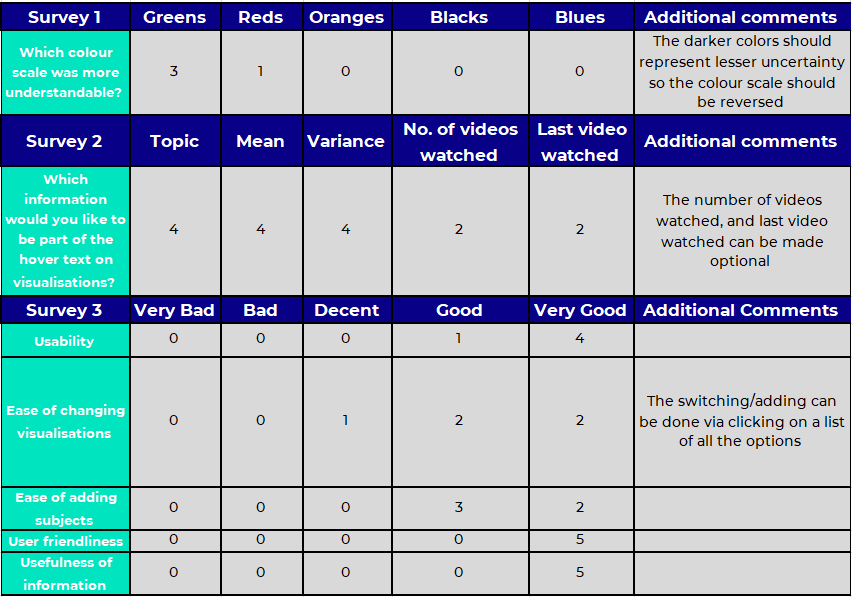
We divided the tests into three cases with each user completing a survey for each one. The survey questions were based on different objectives with an additional option for the user to leave comments.
Case 1: One of our main objectives for our visualisations was to make them understandable for learners. Therefore, we showed the user our bar charts, bubble charts and rose charts in 4 different color scales. In the survey questions, we asked them which color scale they found the clearest. Each tester could vote only once.
Case 2: Another visualisation objective was to enable learners to evaluate their skills as well as areas for improvement. So, we gathered relevant information that learners would find useful by asking what data could be provided through interactions namely in the hover text.
Case 3: We developed a web application to display the visualisations to mimic the behavior of an educational platform that uses TrueLearn. We presented it to our surveyors and asked them to rate the web application in terms of ease of use, understanding, and usefulness.
Feedback
Conclusion
After the results mentioned above, we made the following changes to our python library:
- Based on case 1, we used the Greens color scale where we made darker shades represent greater confidence in our classifier's prediction.
- Based on case 2, we decided to include the topic, mean (skill level) and variance (confidence/certainty) in the hover text and inserted an additional parameter into the plotting function so users can choose how many videos to include the number of videos watched for that given topic and the date of the last video watched.
- Based on case 3, we simplified the transitions involved in selecting the type of visualisation and adding subjects to be visualised by allowing for the user to click on them respectively.
Overall, the user acceptance tests have allowed for improved visualisations whilst also increasing the user friendliness of our web application.